Patrik Hoyer and Aapo Hyvärinen, currently of the Neuroinformatics Group at University of Helsinki.
Get the MATLAB package for estimating ICA, ISA, and TICA bases from image data!
Consider a typical natural image:

When we do ICA on image data, that means we are simply trying to find an expansion of the form
![]() =
s1
=
s1![]() +
s2
+
s2![]() +
... + sk
+
... + sk![]()
such that for any given window from the image, information about one of the coefficients gives as little information as possible about the others. In other words, they are independent. In the standard ICA model x = As, the coefficients correspond to realizations of the signals s and the basis windows are the column vectors of A.
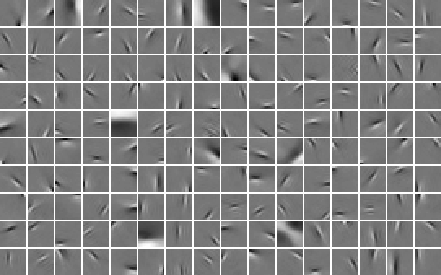
Several investigations by different research groups have indicated that such an objective gives basis windows which are localized both in space and in frequency, resembling the wavelets of signal processing. This is an example of such a basis.

Thus, one may see ICA (and sparse coding, which is closely related to ICA for images) as a way of choosing a basis which is custom-tailored to the data.
We have also introduced modifications of the basic ICA model that describe further aspects of natural image statistics. The modifications use a linear decomposition as illustrated above, but the components si are not assumed to be all independent.
The first model in this direction is independent subspace analysis, in which the components are divided into groups or subspaces so that components in different subspaces are independent, but components in the same subspace are not. In particular, the distribution of the components in a subspace is assumed to depend only on the norm of the projection on that subspace. Typically, this implies that the components of a subspace tend to be active simultaneously.
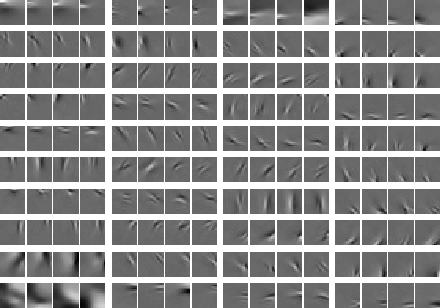
When estimated from natural image data, the model shows emergence of complex cell properties, in particular phase and translation invariance, together with orientation and frequency selectivity. Here are the estimated basis vectors, grouped according to the subspace structure.

Furthermore, we have generalized the independent subspace model so that it models more general dependency structures.
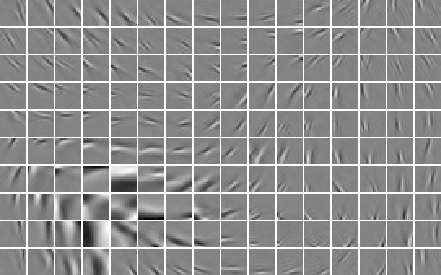
The point is to define a topographic order using the higher-order correlations of the components. Basically, we use correlations of energies, i.e. squares, of the components. Thus we order the basis vectors so that component that are near-by in the topographic representation tend to be active, i.e. non-zero at the same time. This can be considered as a generalization of independent subspaces, so that every neighbourhood corresponds to one subspace. Thus we obtain a linear representation in which the coefficients and the basis vectors have a topographic organization that gives us information on the statistical higher-order structure of the data.
When estimated from natural image data, the model shows simultaneous emergence of topography and complex cell properties. This is because every neighbourhood corresponds to one feature subspace as in independent subspace analysis, i.e. one complex cell.

For details, see the articles available on the publication pages of
Aapo Hyvärinen
and Patrik Hoyer
Some data we are currently using can be found here.
Neuroinformatics Group at University of Helsinki